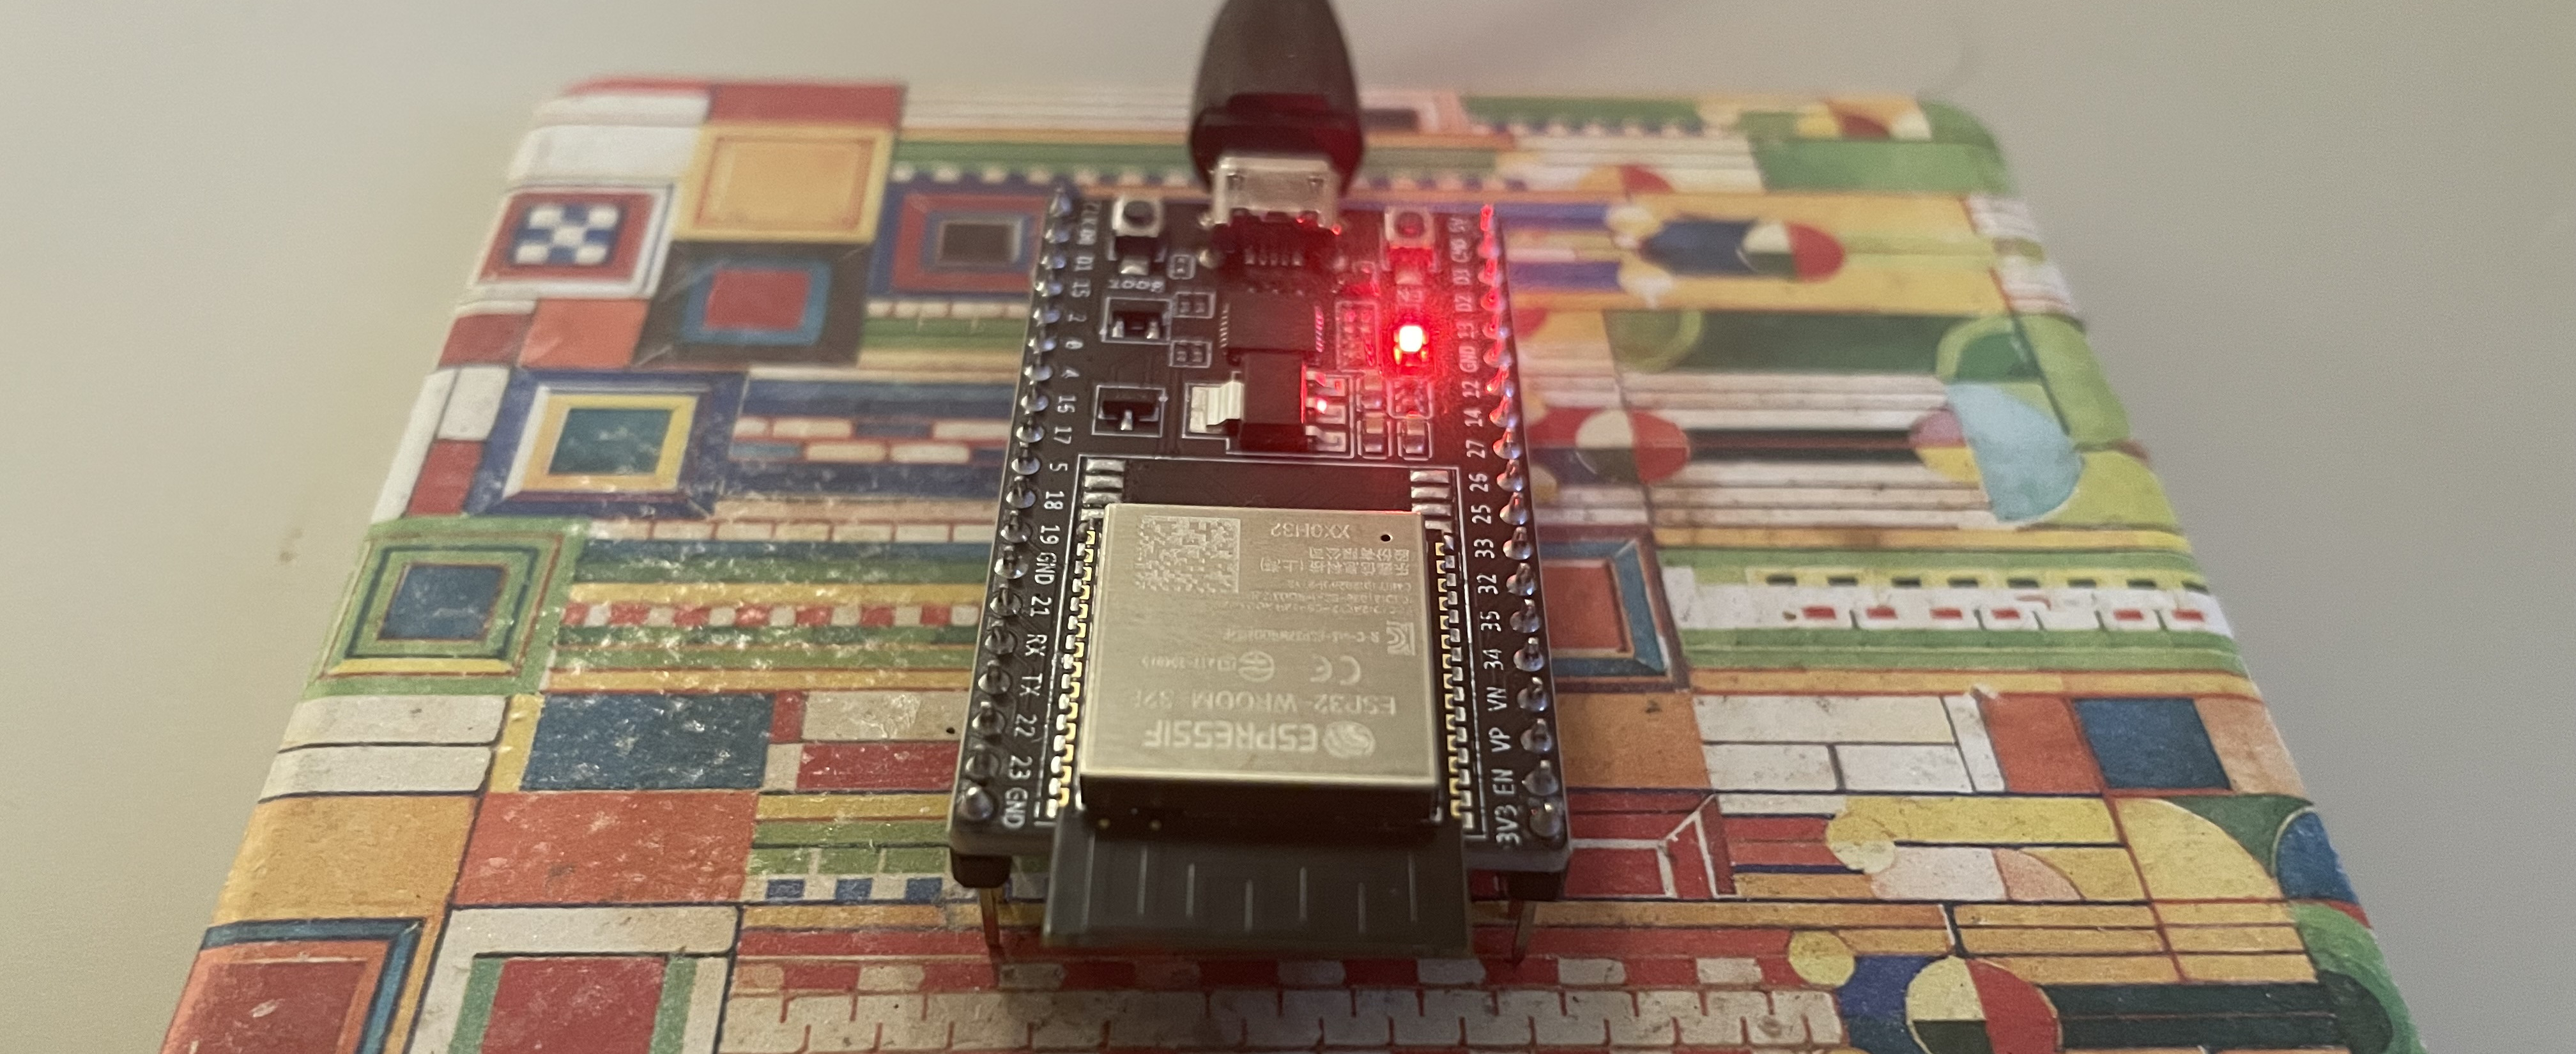
Return to the embedded world: reversing ESP32 firmware
written on February 22, 2026
Recently I had the pleasure of participating in a “CTF initiation” challenge alongside the rest of the BINSEC team, organized by my friend and colleague Grégoire Menguy. Since several PhD students in the team hadn’t yet had the opportunity to participate in such a competition, it was the perfect occasion to try it out by attempting to complete as many challenges as possible from the France Cybersecurity Challenge (FCSC) 2025 on the Hackropole website.
I was pretty rusty myself, since I haven’t had the occasion to participate in such a challenge in quite a long time. We turned to the “intro” challenges as a warm-up, and soon after that we started attempting some of the more difficult ones. In this post, I’d like to describe how I went about solving one of them, specifically a reverse-engineering challenge concerning a piece of ESP32 firmware.
warn
Obviously, MAJOR spoilers ahead, for the CTF challenge itself and possible solutions or hints. I highly recommend you try this for yourself before reading ahead. You have been warned!
Basic analysis
Alright, so the challenge is called Extension. It’s a reverse-engineering challenge, meaning that we’re given a binary program and are expected to dig through it by any means necessary to find the flag. Usually CTFs tell you more or less what the flag is supposed to look like, and that’s the case here too: we’re looking for a string of the format FCSC{<something>}, with <something> usually being a sequence of characters and numbers. To prove that we’ve completed the challenge and found the flag, we need to paste the flag in the appropriate input form field on the challenge page, at which point the site will let us know if the flag is correct.
Let’s read the challenge description, which might provide useful hints:
You find an ESP32 in a trash bin. After connecting to the serial port, it seems to expect a flag.
You manage to dump its flash memory, can you find the flag ?
Okay, so this is indeed an ESP32 flash dump. This already tells us some things: ESP32 is a type of microcontroller, usually running bare-metal code, meaning that usually there is no underlying OS like Linux.
Let’s start by running file on the downloaded binary (always a good way to get more information):
$ shell
Tensilica Xtensa is indeed the Instruction Set Architecture (ISA) used by ESP32 microcontrollers, and we can also see that it’s not stripped; this is great! It means that the symbols (e.g., the function names) have not been stripped away, and we can use them to get useful contextual information as we dig through the binary.
Time to get our hands dirty!
Taking a first look in Ghidra
There are many ways to reverse-engineer a binary. My tool of choice is usually Ghidra, because its decompilation quality is quite good, it supports a wide range of ISAs, and it’s free. I also like Binary Ninja, but unfortunately the free version only seems to support x86 binaries. Ghidra does not support literally everything either: make sure your copy is updated to a recent enough version to make sure you have support for Xtensa, otherwise you might need to go looking for a plugin.
We fire up Ghidra and analyze extension.elf. Neat. Now what?
Remember how I said this was a bare-metal binary? Well, that means that the default entrypoint to the program is not good ol’ int main(int argc, char** argv). So how do we know where to start?
First of all, we can look at the symbols Ghidra has found in the Symbol Tree window. If we scroll through the Exported symbols, we can see a bunch of them starting with esp_. These are part of the ESP32 HAL. Usually, a microcontroller vendor will make a bunch of models for different use cases (e.g., with more or less memory, higher or lower CPU base frequency (and thus energy efficiency) and so on) which might all have slightly different hardware configurations. A HAL is a library which takes care of mapping each hardware model to the right configuration and exposing a uniform API to the programmer of the microcontroller. That way, the programmer doesn’t have to break out the microcontroller manual every time they want to know what address they’re supposed to use for a given peripheral.
If we scroll some more in the same window, we will also come across some references to FreeRTOS, a real-time OS kernel (very lightweight compared to OS kernels like Linux) often used in embedded systems like this one.
The main function
Armed with this knowledge, we can look up what the entrypoint function is for this configuration. Digging around the ESP32 documentation leads us to the hello_world example, which seems to contain a single app_main() function. Indeed, searching for app_main in the Symbol Tree window yields a result, and double-clicking it opens the decompiled code in the Decompile window:
Decompile: app_main
Naturally, this is hard to read at first. However, you’ll notice a few symbols here and there that we can use to refine the types of the different variables and make this much easier to read.
For instance, what are those arg_str0() and arg_end() functions? Some quick searching reveals that they are part of Argtable, a C library used for parsing command-line arguments. Luckily for us, Argtable is open-source, so we can look through the code to get the definitions of these functions. Starting with arg_str0(), we can find its definition in the source code:
argtable3/src/argtable3.h
Similarly, we can find the definition of arg_str_t and all of its parts, until we have the definition of everything used by this function in terms of base C types. Then, we can go ahead and define these types in Ghidra to make the decompiled code clearer. We can do that in the Data Type Manager window, by right-clicking extension.elf, selecting New, and then clicking on the appropriate type. Function Definition is used for function pointer typedefs, Structure for structs, Typedef for other typedefs and so on.
One important thing to note is alignment: for instance, for the arg_hdr_t structure, we need to apply an alignment of four, otherwise stuff will look weird later. Specifically, the first field of the structure (which is a char) actually takes up four bytes with padding, not just one.
Once we have our types, we can right-click each Argtable function and click on Edit Function Signature, and then enter the function signature found in the Argtable source code. Ghidra doesn’t seem to like the const qualifier, so I avoid it, plus it doesn’t really make a huge difference for reverse-engineering purposes. Once we’ve edited the function signatures of both arg_str0() and arg_end(), our decompiled app_main() looks something like this:
Decompile: app_main
Not much seems to have changed, but sometimes progress is not immediately obvious. There are a few additional little things we can clean up: for instance, in the arg_str0() call, we can right-click each 0x0 value and choose Set Equate, then enter NULL. This doesn’t change much either, but in my opinion it makes things a little cleaner, since we know that the first two arguments are pointers to strings or NULL.
In the same arg_str0() call, we can also clean up the rest of the arguments. Double-clicking each of them and looking at the memory values in the Listing window, we can see that the constant s_<flag>_3f4038d4 corresponds to the string "<flag>", while the constant s_Flag_du_challenge_3f4038c0 corresponds to the string "Flag du challenge" (“challenge flag” in French). We can right-click each of them and choose Rename Global, then rename them something like FLAG_ARGUMENT_PLACEHOLDER and FLAG_ARGUMENT_HELP respectively. This does yield a slightly prettier result:
Decompile: app_main
Similarly, we can rename the memory address at the receiving end of the arg_end(2) call. The documentation says that it returns an “end-of-table marker”, so we can call it arg_end_marker:
Decompile: app_main
We’re slowly getting somewhere! Next, let’s tackle the ESP32 HAL functions we can see in app_main(): esp_console_cmd_register(), esp_console_register_help_command(), esp_console_new_repl_uart(), and esp_console_start_repl(). We will not worry about _esp_error_check_failed() for now, since it’s pretty self-descriptive. Again, we can annotate all of these functions and define their types by searching through the ESP32 documentation.
But, what are these functions supposed to do? There are two key words here: UART (Universal Asynchronous Receiver-Transmitter) and REPL (Read-Eval-Print Loop). To understand why we would even reach for those, we need to take a step back and consider how a microcontroller works. Fundamentally, a “desktop” computer (i.e., an actual desktop, a laptop, and whatever other type of “traditional” computer you may be using) shares a lot of common parts with a microcontroller: for instance, they both have CPUs, which handle the actual execution of the instructions they’re programmed to execute. They also both have some type of memory, typically some RAM-style memory (erased after a reboot) and some ROM-style memory (not erased after a reboot).1 Now, when you go to use your “desktop” computer, how do you do so? Well, you have one or more input devices (like a keyboard, a mouse and so on) and one or more output devices (like a screen). If you want to “communicate” with your computer, you could, for example, open a Bash shell, type something like echo hello world, and hit “Enter”. Your computer then would read the command you just typed, evaluate it, and print “hello world” on the screen.
Now what about doing the same on a microcontroller (or, more precisely, a devkit—a microcontroller on a board, plus some handy hardware), such as the ESP32? Most microcontroller boards don’t come with screens or keyboards or mice, so how do we interact with them?2 Thankfully, most of them come with some serial interface, since we definitely need some way to get data on them in order to program them. UART is an extremely common way to achieve this—usually coupled with a UART-to-USB bridge to be able to connect to a “desktop” computer via USB3—which is why it’s super common to see UART-related functions in the HALs which come with microcontroller boards. You don’t need to know the specifics of UART of course, but it helps to roughly understand what its role is when reversing the binary. Okay, what about REPL then? You actually already know what this is: it’s basically what every shell ever does. It reads a command (or expression or whatever, depending on the “shell”), evaluates it (e.g., Bash evaluates $HOME to whatever directory it actually points to), and finally prints something on the screen (sometimes), only to do it all over again. So, in summary, esp_console_new_repl_uart() seems to set up a REPL on the UART interface of the microcontroller, presumably so we can interact with it via standard means through some “desktop” computer.
Now the other functions, like esp_console_cmd_register(), should start making a little more sense: since we’re setting up a sort of “shell”, we need to define what the commands we can type into it are. Here, we only seem to be registering two commands: a “custom” one (via esp_console_cmd_register()) and a “help” one (via esp_console_register_help_command()), which presumably just prints the available commands and how to use them.
Using the ESP32 documentation to create the necessary data structures and annotate esp_console_cmd_register() already yields cleaner decompiled code:
Decompile: app_main
As usual, we can clean up the labels, by observing the constants in memory and by looking at the documentation of the ESP32:
Decompile: app_main
So, what this function does should be clear by now: it registers a “checkflag” command in the REPL, and it uses the argument parsing configuration set up previously with Argtable. The CHECKFLAG_CMD_HELP string says that it “verifies the value of the flag”, so presumably we would enter the value of the flag via the UART REPL, and it would tell us whether or not it’s correct. If the registration of the “checkflag” command fails, we call some failure function, which does a standard microcontroller thing: it causes some exception to be triggered at the CPU level, which in turn causes some fault handler function to be called. We don’t really care what happens in that case (at least for now), but commonly this function reboots the microcontroller—it’s a standard way to “get out of the hole” should the embedded system find itself in one.
There is one last thing we can do for this part (which might be considered a nitpick): Currently, the call to memset() gets a size argument of 0x1c, which on its own doesn’t mean much. However, if we inspect the size of esp_console_cmd_t (which is the type of checkflag_cmd, the first argument passed to memset()), it just so happens to be 0x1c bytes long. We can right-click the value and hit Set Equate, then replace it by sizeof(checkflag_cmd), which makes things ever so slightly clearer:
Decompile: app_main
For completeness’ sake, let’s go through and annotate the rest of app_main():
Decompile: app_main
This is much more readable than what we started with! We can now even see which GPIO pins are used for the UART, what the baud rate is and so on, should we want to debug that later (or even just cross-reference with the hardware documentation). What should we look at next? Naturally, one might be tempted to go into the UART code—since that would follow the logical flow of the program—but that’s most likely not interesting at all. That’s fully entering HAL territory, and while it’s not impossible that the flag could be hidden there, I think it’s worth looking at other things first. For instance, what happens if we run that “checkflag” command in the REPL? Clearly, the .func member of the struct points to a function in the binary! It seems that this function handles the actual checking of the flag, so it’s the perfect candidate to look at next.
The flag checking function
Again, at first this function will probably be a bit of a mess:
Decompile: checkflag
We can start by annotating the function signature itself. We know what this is supposed to look like, because we know what type of “handler” function esp_console_cmd_register() expects. This will propagate the new types of the parameters to the function body, slightly clearing up the intentions of the rest of the code:
Decompile: checkflag
Next up: annotating arg_parse(). This is another Argtable function. I think we can also safely call iVar1 result, since it seems to be storing the result of the call to arg_parse():
Decompile: checkflag
Okay, now what is all that checkflag_args + 0x34 stuff? If you remember, back in app_main(), we established that checkflag_args is a global variable (specifically of type struct arg_str_t *), initialized by Argtable, to help with parsing arguments in the REPL. Given that, then clearly checkflag_args + 0x34 is accessing whatever structure member is found at offset 0x34. Can’t Ghidra figure that out for us? Of course it can! We just need to specify what its type is. Doing so clears up the code by a lot:
Decompile: checkflag
We can now deal with the static data labels. Translating from the original French, s_Arguments_invalides_3f40385c points to a "Invalid arguments" string, DAT_3f403870 points to a "Congratulations, you can validate with %s" string, and DAT_3f40389c points to a "Sorry, try again!" string. Here is the decompiled code after renaming the constants:
Decompile: checkflag
What this function does should now be crystal clear:
- Parse the arguments given to the function, given the argument-parsing rules defined in
app_main(); - If the parsing fails or the number of parsed arguments is zero, print an “invalid arguments” message and skip to step 5 (else continue to step 3);
- Call the
verif()function with the parsed argument (*checkflag_args->svalis essentiallycheckflag_args->sval[0], and the Argtable documentation tells us thatsvalis a table of strings containing all parsed arguments); - If the result returned by
verif()is zero, then print a “success” message (indicating that the flag the user has entered is indeed the correct one), otherwise print a “try again” message; - In any case, return zero.
Of course, the next function to look at is verif().
The flag verification function
The verif() function seems to be by far the longest and gnarliest so far:
Decompile: verif
Let’s start at the beginning. Since verif() is not part of any third-party open-source library or anything, we don’t know what its signature is. We can make a pretty good guess though: it definitely does not take an int as a parameter! In fact, we know that it’s called in checkflag() with a string (which also makes much more sense, since this function is supposed to be verifying the value of the flag entered by the user). Let’s start by changing that, but leaving the return type alone for now, since we don’t currently have any information about it:
Decompile: verif
Again, taking it one step at a time, we can start by giving iVar2 a more meaningful name. Since it’s used to store the return value of strlen(), I think flag_length is an apt name:
Decompile: verif
Let’s try to understand a bit of what the code does before renaming more things. We can see that the top-level if-else branching checks whether the length of the flag string is 0x18 bytes; if so, then we continue through the function, otherwise we set bVar2 to one and return it. We can rename bVar2 to flag_is_incorrect, since it seems to be set to one when the flag does not have the right length, and back in checkflag() the “success condition” is for verif() to return zero. After that, we see that the first 0x18 (24) elements of local_50 are set to zero. Further down in the function, local_50 seems to be edited repeatedly, culminating in playing a role in the final value of bVar2. Specifically, we see code checking whether a part of local_50 contains the string "FCSC". But remember: the flag is a string of format FCSC{<something>}, so an early guess we could make here is that local_50 is the value that ultimately gets compared to the flag. This also makes sense at the conceptual level: this function’s job is to check whether the flag is correct, but it obviously can’t just strcmp() against the actual flag, since that would trivially reveal the correct value. So, in order to make reversing more difficult, it employs some (basic) obfuscation. With this tentative theory in mind, let’s rename bVar2 and local_50:
Decompile: verif
Now, if this is indeed (basic) obfuscation, it’s probably better to first try to split it into pieces. Let’s try to analyze the “first” part, from the initialization of the first 24 bytes of expected_flag up until the call to memcpy(). We can see some and-ing, some shifting, and some XOR-ing using two constants: 0x7f and 0x71. These constants mean nothing to us (at least for now), so I will rename them to magic_byte_1 and magic_byte_2:
Decompile: verif
The only remaining unnamed variables here are uVar4, uVar2 and iVar3. Since the first two are used as loop indices, I will just rename them to i and j. For the last one, I’m not really sure what it does yet, but since it’s used in bit-shifting operations near the end of this code chunk I will just rename it to offset:4
Decompile: verif
Right. Now how do we figure out what this code is supposed to be doing? One way is to take a pen and paper and write down all the operations one by one, trying to discern a pattern and to understand the “big picture” of the obfuscation. That might be fun for some people, but I’d much rather use a computer to speed things up. We can just copy this code and turn it into an actual little program we can run, allowing us to experimentally observe what is going on. My first instinct here was to reach for Python, but I ended up deciding that C is a much better choice: first, this is more or less valid C, so we can more or less just copy and paste code, and second, Python does not have the same type semantics as C—for instance, Python ints don’t overflow in the same way as in C—and so we can’t be sure that the behavior of the Python code and the actual binary we’re analyzing are equivalent.
That being said, let’s create a verif.c file, which we’ll use to play around with and understand the (de)obfuscation code:
verif.c
Of course, I’ve had to include some headers, add some typedefs, and add a main() function for this to compile. I’ve also added a debug_print_string() function which we can use to inspect the content of expected_flag, and I’ve started by calling verif() with a string of a specific size, which is of course due to the top-level if-else statement in verif(): we know that if the flag is not precisely 24 bytes long, then the function will consider that it is incorrect. Running it yields slightly different results each time:
$ shell
It seems that the first part of expected_flag stays the same, while the last part changes slightly with each execution. Based on what we’ve seen so far, this is expected: the first 24 bytes of expected_flag are initialized to zero, thus yielding deterministic results. However, the rest of the bytes (remember, it is 80 bytes long) are not: expected_flag is a stack variable, meaning that it is not stored in the BSS segment, meaning that it is not automatically initialized to zero (it just inherits whatever values are found on the stack at this point).
The next step is the call to memcpy(). How do we translate that to our C program? The quick and dirty way of doing it is to just copy whatever data is found at the source address in Ghidra, make an array with it in our C program, and use that as the source for the memcpy(). While doing so, we can also take the time to rename the DAT_3f403840 constant pointing to that memory address—I’ll call it OBFUSCATED_DATA:
Decompile: verif
Now, to copy the data, we can double-click on OBFUSCATED_DATA in the memcpy() call, then select all of the data (right up to just before the next symbol in memory, which should be INVALID_ARGUMENTS_MESSAGE), then right-click and select Copy Special. In the menu which appears, we need to select C Array and then click OK. Now the data should be in our clipboard, and we can just paste it into verif.c. We can then also go ahead and add the memcpy() call to verif.c:
verif.c
Before moving on, it would be interesting to see what effect the input (flag) has on expected_flag. In order to do that, we can write a little function generating random 24-character strings which we will then feed to verif():
verif.c
Compiling and running it gives this result:
$ shell
We observe more or less the same effect as before: a first part of expected_flag remains stable, while the rest of it differs between executions, because of the random values inherited from the stack memory. Let’s move on.
The next instruction to treat is a breakpoint(). There is no immediately obvious way to handle this right now, so let’s just skip over it. I’m sure it has nothing to do with the flag.
The last part of the (de)obfuscation code uses yet another variable, bVar1, which seems to be XOR-ed around. Again, I don’t have a good name for it, so I’ll just call it hash:
Decompile: verif
To wrap up, let’s copy the code over to verif.c:
verif.c
Before we compile and run this program, what do we expect to get? Let’s recall our current theory: this function ultimately compares a “candidate” flag value (passed as an argument) with the actual flag value, and returns zero if they match, and one if they don’t. Since a direct comparison (e.g., via strcmp()) would immediately give the flag away, (basic) obfuscation is used. In fact, we can even see that the line flag_is_incorrect = flag_is_incorrect | hash ^ flag[flag_length] essentially checks that every character of the “candidate” flag matches the current hash, which itself is just an XOR of two parts of expected_flag, leading overall to a sort of equality check for every character of flag and expected_flag. It follows that, by inspecting the value of expected_flag at the very end of the comparison, we should be able to finally lay eyes on the flag! Let’s try it:
$ shell
I’m sure you can tell that something is up, but to make it very clear, amongst the garbled nonsensical characters that are being printed there is the string FAKE{_BIEN_ESSAYE!_:-)_}, which translates to FAKE{_NICE_TRY!_:-)_}. That’s obviously not the flag! It feels like we’re so close, though… maybe it’s time to look at that breakpoint?
It was the breakpoint all along
How do we handle the breakpoint, though? It’s not a function per se; so, what is it? The Decompile window is cool and all, but sometimes we need to look at the assembly in the Listing window to get a more accurate picture. Single-clicking on the breakpoint() “call” in the Decompile window highlights the following line in the Listing window:
Listing: extension.elf
Hm, time to hit the books. The Xtensa ISA documentation Section 10.7.1 says (bold text mine):
Thebreak(24-bit) instruction has two immediate 4-bit operands, and thebreak.n(narrow, 16-bit) instruction has one immediate 4-bit operand. These operands (informally called “break codes” in this section) can be used to convey relevant information to the debug exception handler. Their exact meaning is a matter of convention. However, some of the tools and software (debuggers, OS ports, and so forth) used with Xtensa cores necessarily make use of the break instructions, so some conventions had to be established. The conventions that have been adopted are described in this section.
Reading further down in the section, it seems that break 1,1 has the following description:
Signals an unhandled level 1 user exception
This comes back to how microcontrollers work. In microcontrollers (such as the ESP32), the CPU will often start executing code at a fixed address. It is the programmer’s responsibility5 to provide code (commonly called startup code), setting up what is known as the Interrupt Vector Table. The latter is just a table of function pointers, which point to different handler functions, to which the CPU will automatically jump to when certain exceptions occur. For instance, every microcontroller has a hard fault handler equivalent, which—as the name suggests—deals with hard faults, which are generally unrecoverable failure states (such as an integer division by zero), and usually just reboots the microcontroller.
Similarly, the break instruction causes some sort of exception at the CPU level, which, as the docs seem to indicate, will lead to the “debug exception handler” being called. In order to get further with this piece of information, we can look around the available documentation (both the Xtensa ISA docs and the ESP32 docs). The ESP32 docs have a page on High Priority Interrupts which seems to be referring to this exact scenario:
Priority Level Symbol Remark … … … dbg xt_debugexception Debug exception. Called on e.g., a BREAK instruction.
Sure enough, if we look up the xt_debugexception symbol in Ghidra’s Symbol Tree window, we come across something that looks suspiciously like the missing piece to our (de)obfuscation puzzle:
Decompile: xt_debugexception
But, what is param_1 here, and of what type is it? Looking on various search engines for the signature of this function yields nothing. So how can we know what specific part of memory is being used here? Let’s rewind a little bit. Remember what the instructions right before the break instruction were doing? Those instructions were used to carry out a call to memcpy(), which in turn copied some (obfuscated) data to the expected_flag buffer. Specifically, expected_flag + 0x18 seems to be stored in register a6 right before the call to memcpy(). Then, right before the break instruction, we see a mov.n a2, a6 instruction, and Section 10.1.1, table 260 of the Xtensa ISA documentation says that a2 is used to store the first argument to the called function. Putting all of this together, it seems that the param_1 argument passed to xt_debugexception is indeed expected_flag.
All that remains now, is to first copy this code to our verif.c file (taking care to replace breakpoint() by a simple call to xt_debugexception()), compile, and run it:
$ shell
And, checking on the Hackropole website, FCSC{9e23d6cff405da7434} is actually the right flag!
Testing on an actual ESP32
As a matter of fact, I happen to own an ESP32, so we can test with the actual board! I won’t go through the whole process (the ESP32 docs describe it pretty well), but obviously you need to install the ESP32 toolchain to be able to program and flash the microcontroller itself.
What the challenge gives us is an ELF file, which is not what the microcontroller takes as “input” when programmed. It actually needs to be a binary file (often called a binary blob), and the ESP32 toolchain has a nifty little tool to do exactly this:
$ shell
This creates an extension.bin file, and we can use esptool.py to flash it onto the ESP32:
$ shell
We indeed want to write into the flash memory (as mentioned on the challenge page itself, this is supposedly a flash dump), and the 0x10000 address can be found by looking at the partition tables or simply the example commands in the ESP32 documentation.
Now that the firmware should be flashed onto the ESP32, we can use something like minicom to communicate with the device. The baud rate to use is actually found in the decompiled app_main(): if we double-click on the renamed UART_BAUD_RATE constant, we see a value of 115200. Let’s try it out:
$ shell
Hm, nothing shows up? Let me hit the reset button on the board…
$ shell
Hey, we got the FCSC prompt! And finally, let’s try out the flag:
$ shell
The message roughly translates to “Congratulations, you can validate [the flag on the Hackropole website] with FCSC{9e23d6cff405da7434}”, so we get another confirmation at the microcontroller level!
This has been so fun to hack on for me, thanks for reading all the way to the end! I hope I’ll find some time to hack on some more embedded challenges like this in the near future :)